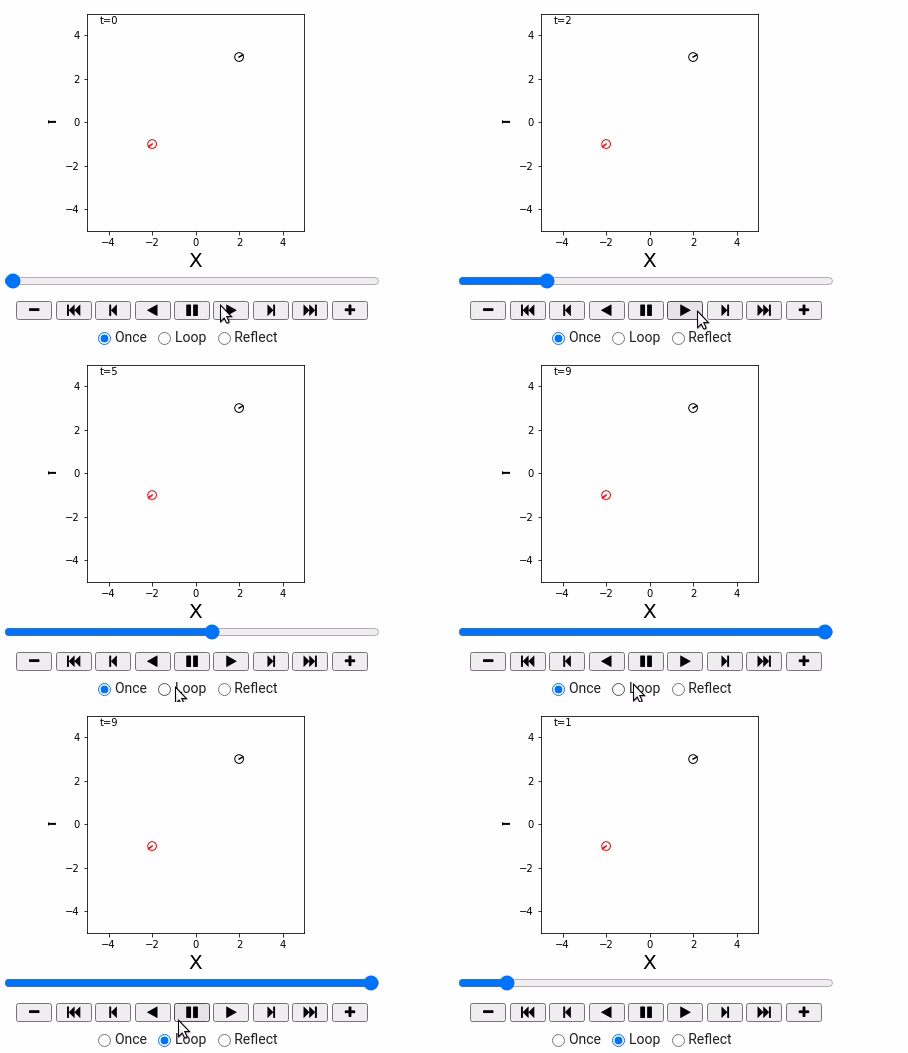
用动画来绘制Robot仿真环境

Objective
- 用动画来绘制Robot仿真环境

重要函数
matplotlib.animation.FuncAnimation
class matplotlib.animation.FuncAnimation(fig, func, frames=None, init_func=None, fargs=None, save_count=None, *, cache_frame_data=True, **kwargs)[source]
- intervalnumber, optional Delay between frames in milliseconds. Defaults to 200.
- frames iterable, int, generator function, or None, optional
- fargstuple or None, optional Additional arguments to pass to each call to func.
Refer https://matplotlib.org/api/_as_gen/matplotlib.animation.FuncAnimation.html for detail.
matplotlib.pyplot.plo
matplotlib.pyplot.plot(*args, scalex=True, scaley=True, data=None, **kwargs)
注意其返回值为: lines A list of Line2D objects representing the plotted data. 是一个列表对象。
笔记
- one_step の引数は、ステップの番号iと,描くする図形のリストelems,サブプロットaxです。
- anm.FuncAnimationに渡している引数は,順に図のオブジェクトのfig, 1ステップ時刻をすすめるメソッドone_step、one_stepに渡している引数、描くする総ステップ数frame、ステップの周期interval (単位ms), 繰り返し再生するかどうかのフラグrepeatです。
elems += ax.plot([x, xn], [y, yn], color=self.color)ここで、appendでなくリスト同士の足しさんになっているのは、ax.plotがリストを返してくるからです。ax.plotの返すリストのオブジェクトリストは、matplotlib.lines.Line2Dという型を持っています。
ax.add_patch(c)
は matplotlib.patches.Circleという型のオブジェクトを単体で返してきますので、これはappendします。
- 今のシミュレーションでは一秒ごとにコマを書き換えしました。あるコマの時刻をt、次のコマの時刻をt+1などと表記します。 这里是用的离散的时间表示的,与实际是不同的。
Examples
%matplotlib inline
import matplotlib.pyplot as plt
import matplotlib.patches as patches
import math
import numpy as np

# Animation
import matplotlib
matplotlib.use('nbagg')
import matplotlib.animation as anm
from matplotlib import rc

%matplotlib inline
class World:
  def __init__(self, debug=False):
    self.objects = []
    self.debug = debug

  def append(self, obj):
    self.objects.append(obj)

  def draw(self):
    global ani
    fig = plt.figure(figsize=(4, 4))
    plt.close()
    ax = fig.add_subplot(111)
    ax.set_aspect('equal')
    ax.set_xlim(-5, 5)
    ax.set_ylim(-5, 5)
    ax.set_xlabel("X", fontsize=20)
    ax.set_ylabel("Y", fontsize=20)

    elems = []


    if self.debug:
      for i in range(1000):
        self.one_step(i, elems, ax)
    else:
      ani = anm.FuncAnimation(fig, self.one_step, fargs=(elems, ax), frames=10, interval=1000, repeat=False )
      plt.show()


  def one_step(self, i, elems, ax):
    while elems: elems.pop().remove()
    elems.append(ax.text(-4.4, 4.5, "t="+str(i), fontsize=10) )
    for obj in self.objects:
      obj.draw(ax, elems)

class IdealRobot:
  def __init__(self, pose, color="black"):
    self.pose = pose
    self.r = 0.2
    self.color = color

  def draw(self, ax, elems):
    x, y, theta = self.pose
    xn = x + self.r * math.cos(theta)
    yn = y + self.r * math.sin(theta)
    elems += ax.plot([x, xn], [y, yn], color=self.color)
    c = patches.Circle(xy=(x,y), radius=self.r, fill=False, color=self.color)
    elems.append(ax.add_patch(c))

%matplotlib inline
world = World(debug=False)

robot1 = IdealRobot(np.array([2, 3, math.pi/6]).T)
robot2 = IdealRobot(np.array([-2, -1, math.pi/5*6]).T, "red")
world.append(robot1)
world.append(robot2)

world.draw()

# this is needed to show animation whithin colab
rc('animation', html='jshtml')
ani    # or HTML(anim.to_jshtml()
Archives
2019/03 (14) 2020/08 (1) 2021/01 (2) 2021/05 (2) 2021/12 (2) 2022/03 (2) 2022/04 (2) 2023/12 (2) 2024/01 (5) 2024/04 (1) 2024/05 (1)Tags
Recent Posts