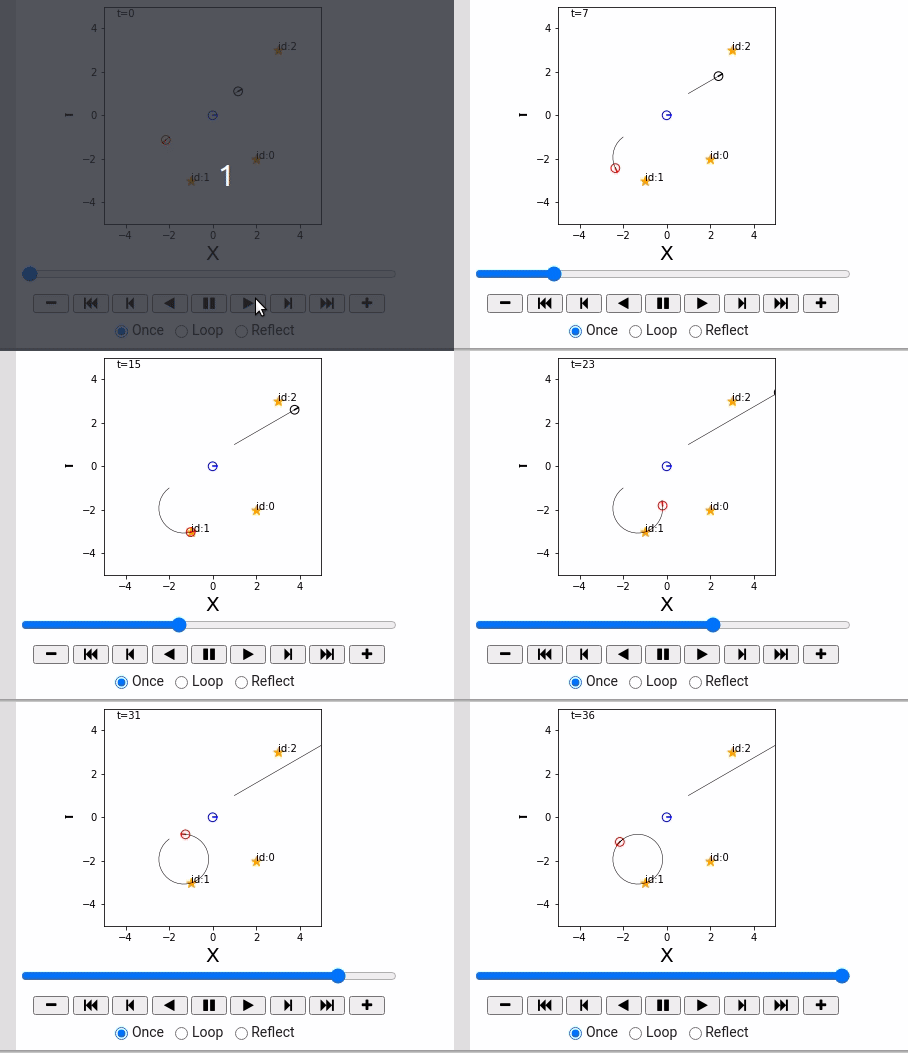
绘制Landmark

绘制地图点
Overview
概率机器人详解 (Python) 3.3.1 点ランドマークの設置

本文将介绍:
- Landmark 是什么
- 如何绘制Landmark
- 实现Landmark 类与Map类的框架
理论
- 地标: $m = { m_j|j=0, 1,2,…, N_m-1 }$ 总共 $N_m$个。
- 地图:记录所有地标的位置。
- 地标 $m_j$: 在世界坐标系下的座标表示为: $m_j = ( m_{j,x}, m_{j,y} )$.
关键代码
Landmark class:
class Landmark:
  def __init__(self, x, y):
    self.pos = np.array([x, y]).T
    self.id = None

  def draw(self, ax, elems):
    c = ax.scatter(self.pos[0], self.pos[1], s=100, marker="*", label="landmarks", color= "orange")
    elems.append(c)
    elems.append(ax.text(self.pos[0], self.pos[1], "id:" + str(self.id), fontsize=10))
Map class:
class Map:
  def __init__(self):
    self.landmarks = []

  def append_landmark(self, landmark):
    landmark.id = len(self.landmarks)
    self.landmarks.append(landmark)

  def draw(self, ax, elems):
    for lm in self.landmarks:
      lm.draw(ax, elems)
注释
- 使用List来存放Landmark
- 这里有一个技巧,使用list的长度来作为Landmark 的ID
landmark.id = len(self.landmarks)
Full sample code
    # -*- coding: utf-8 -*-
    """ch3.3.1 robot model

    Automatically generated by Colaboratory.

    Original file is located at
        https://colab.research.google.com/drive/1MhN_M2QWqelAvr4TGhM_-QewTDPkamYy
    """

    # Commented out IPython magic to ensure Python compatibility.
    # %matplotlib inline
    import matplotlib.pyplot as plt
    import matplotlib.patches as patches
    import math
    import numpy as np

    # Animation
    import matplotlib
    matplotlib.use('nbagg')
    import matplotlib.animation as anm
    from matplotlib import rc

    """# Draw world coordinate"""

    class World:
      def __init__(self, time_span, time_interval, debug=False):
        self.objects = []
        self.debug = debug
        self.time_span = time_span
        self.time_interval = time_interval

      def append(self, obj):
        self.objects.append(obj)

      def draw(self):
        global ani
        fig = plt.figure(figsize=(4, 4))
        plt.close()
        ax = fig.add_subplot(111)
        ax.set_aspect('equal')
        ax.set_xlim(-5, 5)
        ax.set_ylim(-5, 5)
        ax.set_xlabel("X", fontsize=20)
        ax.set_ylabel("Y", fontsize=20)

        elems = []

        if self.debug:
          for i in range(1000):
            self.one_step(i, elems, ax)
        else:
          ani = anm.FuncAnimation(fig, self.one_step, fargs=(elems, ax), frames=int(self.time_span/self.time_interval)+1, interval=int(self.time_interval*1000), repeat=False )
          plt.show()

      def one_step(self, i, elems, ax):
        while elems: elems.pop().remove()
        elems.append(ax.text(-4.4, 4.5, "t="+str(i), fontsize=10) )
        for obj in self.objects:
          obj.draw(ax, elems)
          if hasattr(obj, "one_step"): obj.one_step(1.0)

    class Agent:
      def __init__(self, nu, omega):
        self.nu = nu
        self.omega = omega

      def decision(self, observation=None):
        return self.nu, self.omega

    """# Robot Object"""

    class IdealRobot:
      def __init__(self, pose, agent=None, color="black"):
        self.pose = pose
        self.r = 0.2
        self.color = color
        self.agent = agent
        self.poses = [pose]

      def draw(self, ax, elems):
        x, y, theta = self.pose
        xn = x + self.r * math.cos(theta)
        yn = y + self.r * math.sin(theta)
        elems += ax.plot([x, xn], [y, yn], color=self.color)
        c = patches.Circle(xy=(x,y), radius=self.r, fill=False, color=self.color)
        elems.append(ax.add_patch(c))

        self.poses.append(self.pose)
        elems+=ax.plot( [e[0] for e in self.poses], [e[1] for e in self.poses], linewidth=0.5, color="black")
      @classmethod
      def state_transition(cls, nu, omega, delta_t, pose):
        theta_t_pre = pose[2]
        if math.fabs(omega) < 1e-10:
          return pose + np.array([nu * math.cos(theta_t_pre),
                                      nu * math.sin(theta_t_pre),
                                      omega
          ]) * delta_t
        else:
          return pose + np.array([  nu/omega * (math.sin(theta_t_pre + omega * delta_t) - math.sin(theta_t_pre)),
                                  nu/omega * (-math.cos(theta_t_pre + omega * delta_t) + math.cos(theta_t_pre)),
                                  omega * delta_t
          ])

      def one_step(self, time_interval):
        if not self.agent: return
        nu, omega = self.agent.decision()
        self.pose = self.state_transition(nu, omega, time_interval, self.pose)

    class Landmark:
      def __init__(self, x, y):
        self.pos = np.array([x, y]).T
        self.id = None

      def draw(self, ax, elems):
        c = ax.scatter(self.pos[0], self.pos[1], s=100, marker="*", label="landmarks", color= "orange")
        elems.append(c)
        elems.append(ax.text(self.pos[0], self.pos[1], "id:" + str(self.id), fontsize=10))

    class Map:
      def __init__(self):
        self.landmarks = []

      def append_landmark(self, landmark):
        landmark.id = len(self.landmarks)
        self.landmarks.append(landmark)

      def draw(self, ax, elems):
        for lm in self.landmarks:
          lm.draw(ax, elems)

    # Commented out IPython magic to ensure Python compatibility.
    # %matplotlib inline
    world = World(time_span = 36, time_interval = 1, debug=False)

    straight = Agent(0.2, 0.0)
    circling = Agent(0.2, 10.0/180*math.pi)
    robot1 = IdealRobot(np.array([1, 1, math.pi/6]).T, straight)
    robot2 = IdealRobot(np.array([-2, -1, math.pi/5*6]).T, circling, "red")
    robot3 = IdealRobot(np.array([0, 0, 0]).T, color="blue")
    world.append(robot1)
    world.append(robot2)
    world.append(robot3)

    # Map
    m = Map()
    m.append_landmark(Landmark(2, -2))
    m.append_landmark(Landmark(-1, -3))
    m.append_landmark(Landmark(3, 3))
    world.append(m)

    world.draw()

    # this is needed to show animation whithin colab
    rc('animation', html='jshtml')
    ani    # or HTML(anim.to_jshtml()
Archives
2019/03 (14) 2020/08 (1) 2021/01 (2) 2021/05 (2) 2021/12 (2) 2022/03 (2) 2022/04 (2) 2023/12 (2) 2024/01 (5) 2024/04 (1) 2024/05 (1)Tags
Recent Posts